|
Part Fifteen
MAJOR TWEETER
COMPARISON:
1. Peerless HDS 810921:
Extraordinary Value
2. Scan-Speak D30: High Price,
High Quality
3. Vifa XT25 as Reference: Used
in earliest Mk-1 Elsinores
Preliminary thoughts: The original Elsinores
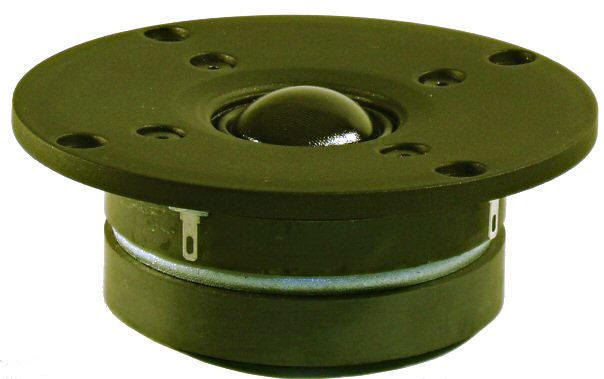
introduced mid-2006 used the Vifa (now called Peerless V-Line)
XT25 Tweeter. This version of the Elsinores are
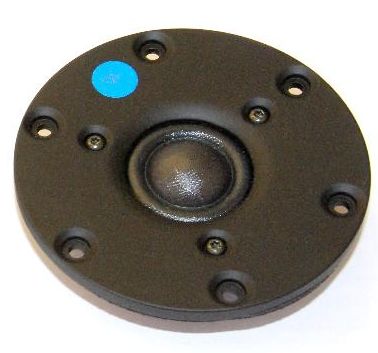
now referred to Mark 1. In 2007 we now use a new Tweeter, the Peerless HDS
810921.
The following was presented in a thread on
www.diyaudio.com - it was primarily a
discussion and comparison of two tweeters: The latest Scan-Speak
D3004/660000 Tweeter (D30 for short) and he new
Peerless HDS Tweeter. As part and also used in
calibration of the test setup, the XT25 is also
partly featured. But both newer tweeters outclass the
XT25 in all areas except flat response. The D30
is 4 Ohm and makes it less suitable for the Elsinores. The Peerless
HDS is 8 Ohm and its cost is higher than
XT25, but nevertheless much less expensive than
D30.

Peerless
HDS 810921 (now called Scan-Speak D2608/913000)
Scan-Speak Website Info

Scan-Speak D3004/660000
Scan-Speak Website Info
The XT-25 is also known as Discovery
R2604/832000
START COMPARISON:
Scan-Speak D3004/660000
Versus Peerless HDS 810921
Will take this step by step. Frequency Response first.
Even though this will be a comparison between Scan-Speak D3004/660000 and
Peerless HDS 810921, the will be referred as D30
and HDS subsequently. Please also note the
colours will be consistent throughout. At the beginning the Vifa (now
Peerless V-Line) XT25 will be Green.
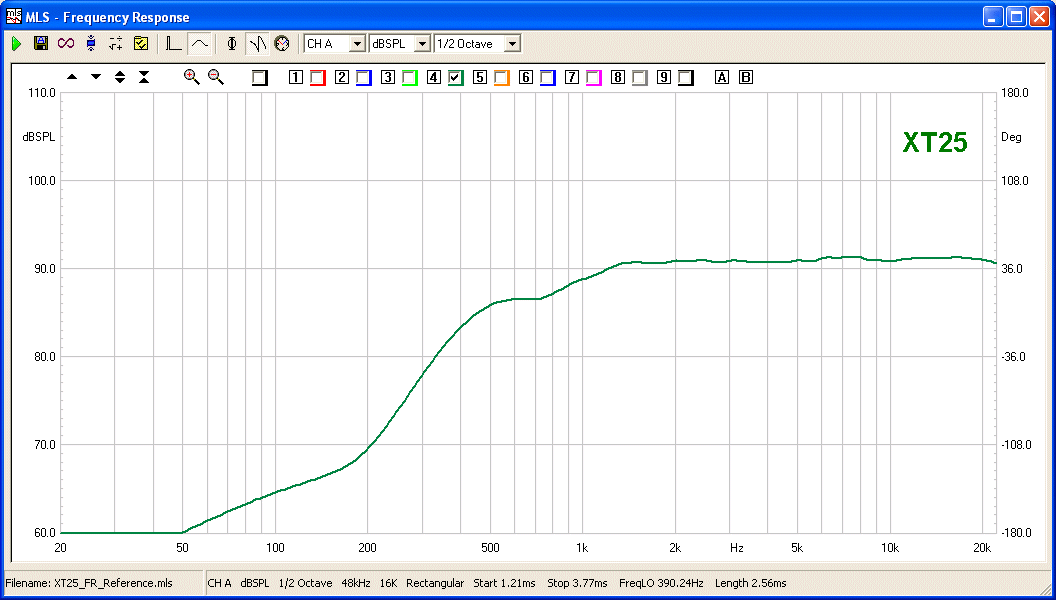
The XT25 has a predictable response and is easy
to reference to 91dB @ 1M with 2.83V RMS input:

Has there ever been a flatter
frequency response by ANY tweeter, period? AWESOME! This is of course ON
axis, so let us not be premature to give it a tick of approval. These FR
measurements are taken @ 700mm which means, given that this is a 4 Ohm
nominal tweeter, normally would require 2W @ 91dB. This is 700mm and thus
3dB less power - 1W.
The response is accurate down to 1300-1400Hz. It is not a full size IEC
baffle. Besides, ultimately it is the final in-box response that matters.
This tweeter is a great reference tool. I allows you to calibrate your
system to better than reasonable accuracy, given that it is a consistent
91dBSPL and FLAT. Just make sure that it is flush mounted (don't try measure
it any other way) on a large rectangular baffle, does not have to be as big
as an IEC baffle (although that would be good).
Next D30:

Much more sensitive by 2-3dB, quite useful. Depression @ 8.5KHz and 16KHz
peak. Will be interesting to see what happens to those when looking OFF
axis.
Next HDS

This has the least flat response of the three.
Now for OFF Axis Response Family :

These are 25° OFF axis. Both D30 and
HDS look good, D30
averages almost flat in the top octave. HDS
looks very smooth here but not too badly rolled off. BUT
XT25 has died. Just as its ON axis is smooth,
so is its OFF axis response, but it starts to die at 2KHz and is minus 20dB
down @ 20KHz.
The D30 has the highest sensitivity (voltage), but
since the HDS is 8 Ohm, it shades the
D30 in efficiency (voltage times current). The
XT25 is the hardest to drive. This is not
inconsequential as I see it. At the same (relative) SPL this means greater
heat in the voice coil and potentially greater dynamic compression, all
other things being equal (are they?).
The winner here is D30. HDS
is OK, even though it has the worst ON axis response, its OFF axis response
is redeeming especially when compared with XT25
.
XT25 now exits.
Next: CSD.
(21 more graphs to come).
Based on the same MLS/impulse
response, here are the CSDs:
D30 :

HDS :

Did not spend a lot of time on this. Windowed the impulse response and
omitted and limit set to 30 lines.
Take your pick.
Joe R.
PS: For those who wanted to take a look at
XT25 :

Next: Harmonic 2-5 Distortion graphs.
Harmonic Distortion Graphs
These are done at 125mm on axis. Please note the dBSPL scale on the left.
This relates to the SPL actually seen by the measurement mic. If you wish to
convert to 1 Metre - then minus 18dB. Thus the first set of graphs set to a
max of 110dB would equate to 92dBSPL.
We will start with 110dBSPL max.
D30 :

There is that elevated 2nd but higher order are well suppressed and
generally going downwards with rising frequency.
Now compare with Next HDS:

Lower 2nd but 3rd is not generally as low as D30
.
Next 100dBSPL.
D30 :

Still elevated 2nd but look at that 3rd as well as higher orders, super!
Now compare with Next HDS:

Despite the elevation of 2nd in D30 it is the 3rd
that stands out as better than HDS.
Next 90dBSPL.
D30 :

Since 90dBSPL equates to 72dB, this is near respectable listening range IMO.
At these levels the 2nd is no longer elevated and the results are near
exemplary.
Now compare with Next HDS:

Quite good as well, but notice that here the tables are turned with
respect to 2nd. Now it is the HDS that has a
rising 2nd, which it had at higher level plots as well. But unlike
D30's elevated 2nd, the
HDS has not lost its rising 2nd entirely, but its
lower end 2nd is even better suppressed than D30.
But BOTH are very credible performers.
The winner? It is so close as to be near a tie, but better 3rd order gives
it narrowly to D30.
Joe R.
Next: THD.
THD.
Same method, 125mm etc. But instead of changing levels, we change frequency
- 100dBSPL was chosen.
First 1KHz- the lower the frequency, the greater the demand on the tweeter.
D30 :

That looks like high THD - 1.325% - but it is dominated by the 2nd.
HDS:

Yes, the THD is lower, but look closely. In D30
the 2nd is greater than 3rd whereas HDS 3rd is
greater than 2nd. This makes the Total Harmonic Distortion figures
misleading.
Let's go onto 2KHz.
D30:

Still dominated by 2nd, but 3rd is just noticeable and higher suppressed.
HDS:

Lower 2nd but higher 3rd.
Now 4KHz.
D30:

Nicely cascading - a good sign a la Jean Hiraga.
HDS:

Pretty much a draw here.
OK, where does this get us? Note that in every set of plot
HDS measures lower? Yes, THD is misleading, only
by breaking the figure into individual harmonic components can we see the
real picture.
The winner. Curiously that every THD favours HDS,
yet as above D30 is a narrow winner.
What do you think?
Next: IMD Tri-Tone Tests.
IMD Tri-Tone Tests.
This is the last 'chapter.'
The Tri-Tones will be centered around 1KHz, 2KHz and 4KHz. Two out of three
adjusted to 100dBSPL @ 125mm.
1KHz
D30:

HDS:

2KHz
D30:

HDS:

4KHz
D30:

HDS:

The winner? This time you tell me. The calculated IMD figure
overwhelmingly favours HDS - what do you think?
So there you have it. Spend some time analysing the graphs, maybe you
noticed something I didn't? I have tried to keep running comments to a
minimum, only guiding where I feel appropriate. Where I have discussed a
so-called 'winner' it is only to point that summed distortion figures - and
hence into a single figure - can be misleading. This alone should be
discussed.
Other factors: If you are assembling a 4 Ohm speaker system and don't mind
paying the extra money, then you should consider the
D30. But if you are aiming at a sensitive speaker system
and 8 Ohm, then HDS is for you. If cost is a
consideration (Madisound lists a 3.7:1 price ratio), then the
HDS is made for you!
The final thing that stands out is in relation to
D30: The shelved 2nd order distortion. There seems to have
been made a conscious decision to trade off greater 2nd harmonic distortion
for a lower level 3rd. This alone strikes me as the single overall most
important conclusion regarding its behaviour and maybe why these two samples
here measure differently than earlier 2006 samples (these are definitely
2007).
Over to you guys!
Joe R.
Thanks for the tests, Joe. It's good to see this
level of thoroughness.
The calculated IMD% number, like THD, is heavily weighted by 2nd order
products. A good way to compare these is to just drop one on top of the
other to compare the whole spectrum. We'll call that Mark K style, since
he's the only guy I see doing that. Praxis has it built in, but if I want to
do it in SE, I have to use an image editing program.
Your results are actually very close to both mine and Mark's, done on 2006
tweeters. The SPL of the 6600 seems to be the same, and the only real
difference seems to be minor variations in the top octave.
Unfortunately, there's minor variations in the top octave for all the 6600's
from 2006. I've tested 4, my own pair and another pair, and just about every
one had a mildly different top octave. Peak at 20kHz (2), dip at 12kHz with
a plateau above (1), and perfectly flat out to 35kHz (1). I don't put a lot
of value in the top octave response, as long as it's somewhat there. The
important part of the response curve starts at the low end, IMHO.
Thanks,
John
-Zaph|Audio-
Using a Waveguide and affect on the Off Axis reponse:
Just as an afterthought, come back to the earlier
posted posted graph that shows the family of OFF axis of Scan-Speak D30 (RED),
new Peerless HDS (BLUE) and Vifa XT25 (GREEN):

It's the XT25 that is of interest here.
Now note below the same tweeter that I have measured with a
square waveguide used in my Elsinore Project speakers:
Addendum 2019:
Waveguide for Peerless HDS 810921 (now also known as Scan-Speak
D2608/9130)
From Elsinore Mk-5 and the current Mk-6 Elsinores, this custom made
Wave was made available:

Link to order Pair of Waveguides
AUD $190 including Air to any part of the world.
Please note that this Waveguide can be used for other
personal DIY projects.
Waveguide Responses:

Both are calibrated dBSPL measurements ON
axis, 15°and 30° OFF axis.
Note that the Waveguide has 'gain' that decreases with frequency. By using a
smaller value series capacitor, this gets EQ (equalised) to flat and -6dB at
the 3KHz crossover frequency.
What is not shown is that distortion is dramatically lower with the
Waveguide, especially near the 3KHz crossover. This also translates into
greater power handling when a null network is added to work an octave below
3KHz. People like the sound of ribbon tweeters, if they do, they will also
like what the Elsinore speakers do.
Joe R.
|