Part Eight
[Note: September 2024 - Elsinore Mk6 is current - some things may be
obsolete]
Notes On Computer Modelling
The following page was written
with Mark 1 Elsinores in mind:
As mentioned earlier, the driver's acoustic
measurements are all gathered from a single microphone position. This
simplifies the computer modelling. It is not always understood that a
measured frequency response also carries the phase information. But
both the amplitude and phase are only relative to that position and
no other. So let us revisit that earlier illustration:
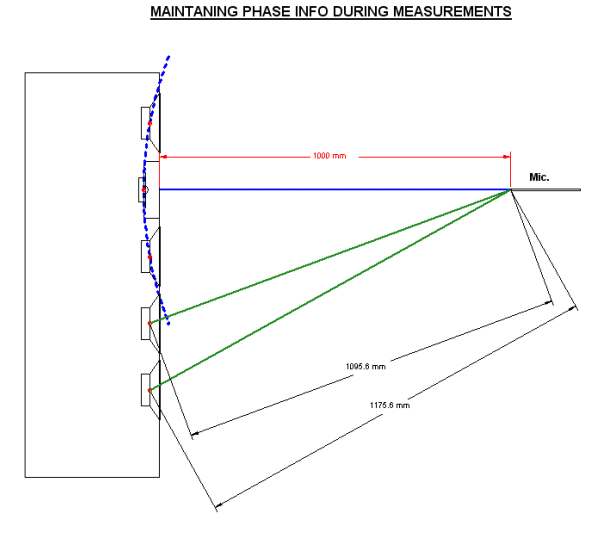
To sum up, the top three drivers
are in Point Source configuration (but the captured acoustic data assumes
all drivers are Point Source). So we need to model the tweeter by
capturing both its acoustic response and its impedance. These are imported
in our modelling program, SoundEasy Version 11. The two drivers above and
below the tweeter are connected in series and once again acoustic
response and impedance measured. Finally the two lower bass drivers, also
connected in series, are also measured in the same manner.
The software then is able to
produce three files, these contain the Complex Transfer
Characteristics based on those measurements, both acoustic and
electrical (the last is the impedance and impedance phase of the drivers in sets/series wiring).
We shall call these the driver CTC from here on.
Note: The MidBass Drivers are
paired and measured as if a single driver. Both their acoustic and
electrical characteristics are combined.
This approach
and the single position microphone reference enormously simplifies modelling
and allow us to measure four sets of modelling using the reference mic
positions with much greater ease.
Four Times Modelling
Yes, four times. The diagram below
shows two ON axis and two OFF axis. One set at 1 Metre and the other at two
Metres.
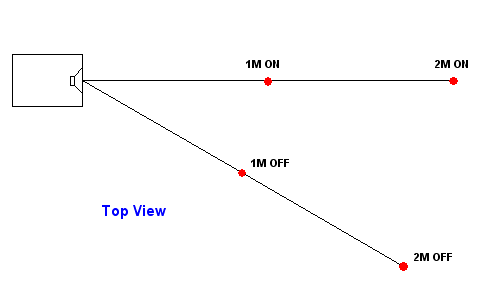
For those familiar with the principle of weighing,
there is an interesting conclusion we can make from the above four reference
positions. The one and two metre On Axis measure the frequency
response. These are discrete measurements only. But the one and two
metre Off Axis reveal something more akin to the power response. In
fact this off axis measurement should be weighed as much as two times more valid as
the on axis one. Why? Because if we measure off axis, then we are
really doing two measurements in one. If we did the same measurement
from the other off axis, then this would be identical (this is
because the vertical alignment of the drivers in the centre of the box, i.e.
lateral symmetry). Can you understand this? Well, understand this, the off
axis is twice as revealing as the on axis. This is indisputable.
Stripped Down Modelling (Point Source)
A quick explanation what is meant by 'Stripped Down
Modelling' - this could also described as 'Bare Minimum Modelling.' A
minimal approach where both measurements and modelling assumes Point
Source.
Today's software can simulate so many variables in
speaker design. The SoundEasy modelling program has a bewildering array of
these, a huge feature set. While these are not without benefit (they are
great for research and discovery of all sorts of interesting things), the
fact is that real data is better than simulated data. Perhaps better
put this way, real data is more reliable, you can bank on it. You can
model it more reliably.
Brad Serhan and myself developed an approach that
minimises simulation, relies on measured data that is gathered in situ,
so the driver must be in box, the microphone in potential
listening position etc. Thus we don't have to model the box and driver
position, but can concentrate on modelling the crossover only.
This means that the box must be modelled first
separately, sort out the box alignment, the physical location of drivers on
the baffle, in fact everything box related. NOW we can use the two
illustrations above and we have a workable methodology.
The Process
MidBass Driver: The electrical data is
effectively the same for
all four, but the acoustic data are not (because they have different
physical locations they have different acoustic outputs). These must be collected as sets. Note I
call them sets as the following data has been collected.
1. Tweeter - on its own
2. Top two MidBass Drivers (nearest
Tweeter), in series as one set (16 Ohm)
3. Bottom two MidBass Drivers, also connected in
series and as one set (16 Ohm)
Above three must be measured
four times and hence four sets. So now we generate CTCs of all of
them, that is a total of twelve CTCs.
The Software used for this is SoundEasy Version 11.
See SoundEasy Home Page.
To look at the Driver Parameter Editor for the
MidBass combination, see here.
To look at the Driver Parameter Editor for the Bass
(bottom two) combination, here.
To look at the Driver Parameter Editor for the
Tweeter, see here.
To look at the Crossover CAD, see
here.
After constructing our CTCs from
the Driver Parameter section, then it is the Crossover CAD where most of the
action takes place. But it is important that when we get to this stage that
we must be absolutely certain that we have captured all data correctly and
with extreme discipline. It will have been all for nothing and the
many hours that will be spent in the Crossover CAD will have been a wasted
period of your life that will amount to nought.
The CTCs contain all the necessary
data, these are all in situ characteristics. Yes, the data files we
call CTCs even contain the data of the box, even though these are named
after the driver or driver combination that makes the CTCs. This is because
these are influenced by the box and thus the box is integrated into the CTCs
(so we do not need to model the box characteristics and driver positions in SoundEasy). This
includes the box tuning (alignment), the diffraction effects of the box, the
way the box changes both the acoustic and electrical response of the
Bass/MidBass drivers and the acoustic response (not so much the electrical,
because the rear is sealed) of the Tweeter.
So assume that we have checked,
double checked and even triple checked that our collected data is all
totally valid, we can now construct our crossover.
Here we can now start to see the
benefits of the Stripped Down Modelling method.
In our above example of the
Crossover CAD, we can see that the Bass (bottom two drivers) are modelled as
a single WO, the MidBass (upper two) as M6 and the Tweeter is T13 (don't be
superstitious).
We draw the Crossover into the CAD
using the symbols on the right. We assign the three driver symbols, WO, M6
and T13, to the CTC files which are imported by giving the modelling program
the file path to those files. This means that we can make the initial
crossover for all four by pointing to different file paths and files
containing CTCs. Then we save into four Projects:
Project A:
1 Metre On Axis
Project B:
1 Metre Off Axis
Project C:
2 Metre On Axis
Project D:
2 Metre Off Axis
From here on, when we make on
change in one crossover, we must replicate it in the other three.
So if one value of resistor etc changes, then that change needs repeating
in the others. What if we make a mistake? One simple trick is to plot the
system impedance as they, unlike the system response, should always be the
same in all four. It is also easy to check visually as any inconsistencies
are immediately obvious to the eye. Any good system must have checks
and balances and this is ours.
As with gathering data, discipline must
be continued and constant check consistency of both data and results.
Confirm and re-affirm that all four projects have identical crossover layout
and values. The
end product is worth the effort and also do not pre-allocate the amount of time
necessary. Many times you will go back and test, try, compare and refine.
Take your time!
All graphs shown will be 5dB per
division.
We shall mainly use "Project A"
as the example - but in reality there four in total.
Why Use Computer Modelling?
Certainly it is possible to design
speakers without modelling, so why do it? It boils down to flexibility and
the ability to explore many possibilities that would otherwise be time
consuming and tedious. As we limit ourselves to model the crossover only,
there are still a near infinite range of possibilities that could not all be
explored if we had to physically build a crossover (and rebuild) over and
over again. What if you don't have the components or the values you want to
try. It could be costly in both time and money - how many inductors,
capacitors and resistors do you want to keep in stock? In modelling we can
use any value, any type of crossover and any idea you
may want to try.
In the following we shall
concentrate, for simplicity's sake, on the 1 Metre On Axis acoustic results,
while keeping in mind that we were also looking at the other three sets (as
mentioned above) as part of the process. It was important to keep the whole
picture in mind. As it is, the on axis measurements do easily demonstrate
the modelling.
Tweeter
Let us look at the Tweeter's
modelling. We want to use low order and non-reactive Hi-Pass filter. But we
also need to suppress the fundamental 500Hz resonance. The XT25 tweeter does
not use ferro-fluid damping in the voice coil gap. Many prefer that, but it
means that the crossover must suppress the resonance in order to get low distortion.
Tweeters, as a general rule, do not like amplitude, they are happy with
velocity. In a first order filter the series element is a capacitor which
has a rising reactance (in Ohms) as we descend in frequency. Think about
that, if the crossover is 3-4Khz and a 6.8uF cap has a reactance around 7
Ohm, then by the time we get to 500 Hertz it will have risen to 47 Ohm. This
will now appear in series with the DC resistance of the voice coil and erode
the Qe (electrical Q) so badly that only Qm (mechanical Q) is now
controlling the tweeter's amplitude at 500 Hertz. The result is a violent
amplitude reaction at the Tweeter's resonance with little to control it and a large increase in
audible distortion.
So we need to dampen that
resonance, effectively try to short this out or very close to it. That would
require high order and even order has an advantage over odd order. The
advantage lies in the fact that a choke ends up in parallel with the voice
coil in even order filters - a good thing. But first order is odd
order, no parallel choke. The solution is a notch filter at the right frequency and correct Q.
Think of Q in this context as the width of the notch filter. Also, a
notch filter is also parallel, just like a choke - again a good thing.
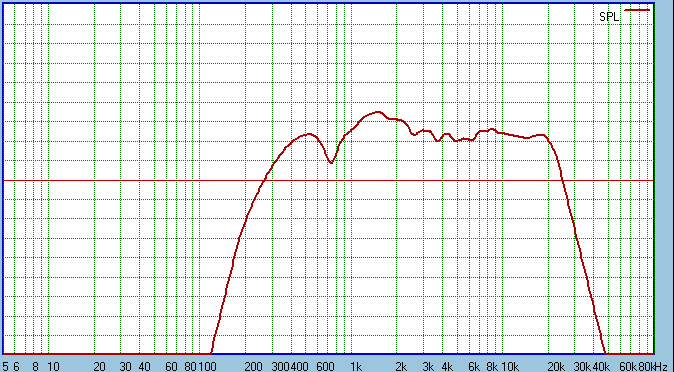
Effectively the response above the desirable crossover
point 3-4KHz is reasonably flat. The normal response should continue in a
flat direction below that. The Diffraction Wedge is here clearly elevating
the response in the area we want. It peaks at 1500 Hertz (+6dB approx) and
would have continued below that if not for the notch cancellation at 750
Hertz. This notch was expected and is a function of the Diffraction Wedge,
but as long as it was well under 1KHz, no harm.
This rise between 3.5KHz and 1500 Hertz is exactly
what we want as that is the transition between the drivers handling the
midrange and where the Tweeter's response will be gradually rolled in. In
other words, it's in the crossover's overlap and where the off axis
of the midrange drivers output gradually fails.
The acoustic impedance is
altered in such a way that it effectively is increasing the radiation area
of the Tweeter's diaphragm - to be closer to matching that of the midranges
in the crossover overlap between 1500 Hertz and 3.5Khz.
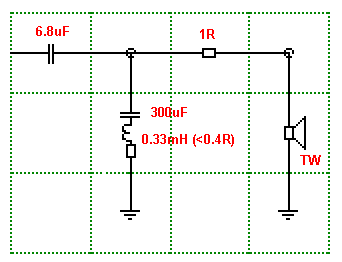
Tweeter Crossover
The parallel network of 300uF and 0.33mH (keep DC
resistance below 0.4R) is the 500 Hertz Notch Filter. This has a Q value
that has been adjusted, as we shall see next:
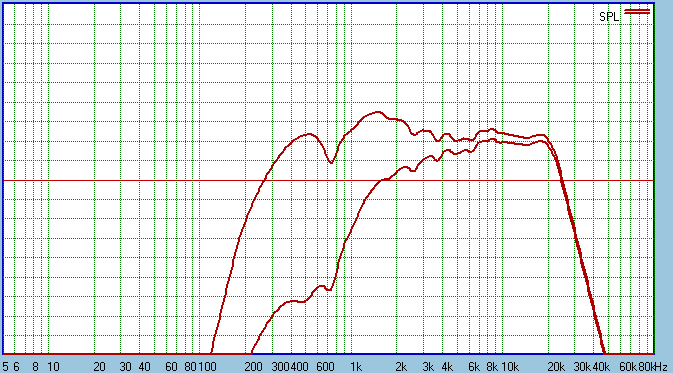
The 500 Hertz Notch can be seen as can the one at 750
Hertz caused by the Diffraction Wedge. One needs to comment on the 2R2 (for
Nomex HDS or 2R7 for PPB HDS) as the Notch Filter would normally be right
across the voice coil of the Tweeter. So 2R2 is in the wrong position?
Here is a classic example of the power of computer
modelling. It turns out that placing 2R2 after the Notch Filter gives
better results in two areas.
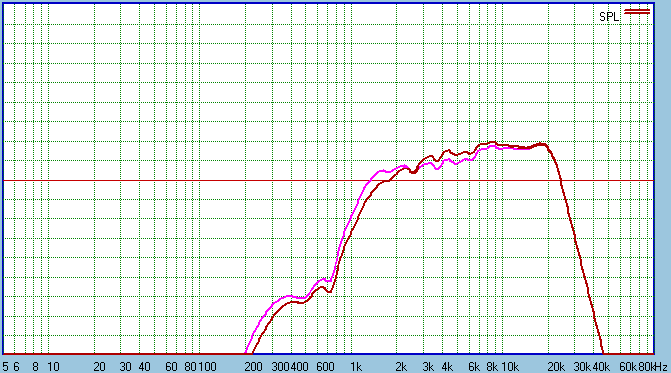
This example uses 2R7 padding value. In the Pink the
2R7 is before (theoretically correct) the Notch Filter and the Red is
(theoretically incorrect) after. Yet the results are clear. The Notch Filter
is more effective in the after example. The Pink line would also
indicate that the series capacitor would need to be larger in value (added
expense) which would worsen the performance of the Notch Filter further. The
Red gives us the best result all round. It does have a slight downside that
it gives a lower Z and negative phase angle in the crossover region. We
shall revisit that topic later.
Bass (Lower Two)
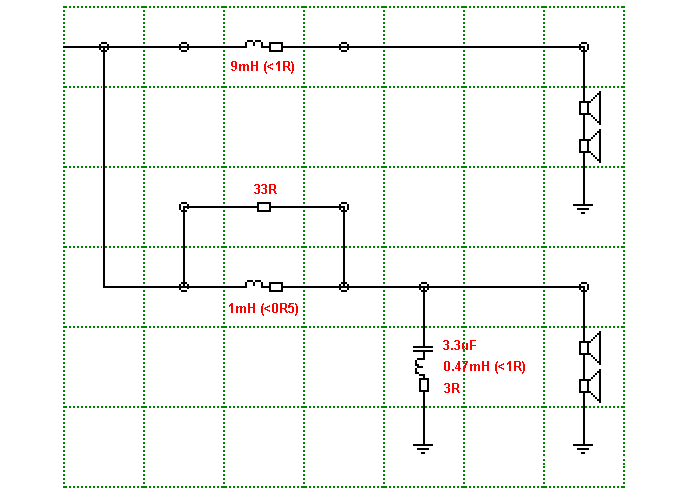
The bottom two drivers are in series but rolled off
gradually using a single choke. The top two drivers are also in series but
not rolled off as such. Yes, there is a choke but the parallel resistor
prevents it becoming a proper low pass filter, so the ultimate roll of is
that of the driver itself.
The four drivers work as a Line Source at low
frequencies and gradually becomes a Point Source (with the Tweeter) as we
move into the mid and high frequencies. It is the following crossover (sans
the Tweeter crossover already shown above) that makes this possible.
This is the raw response of the bottom two bass drivers:
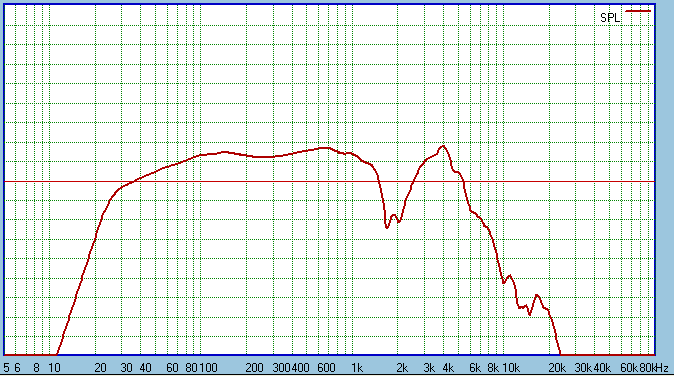
The single 9mH choke gives us the following response:
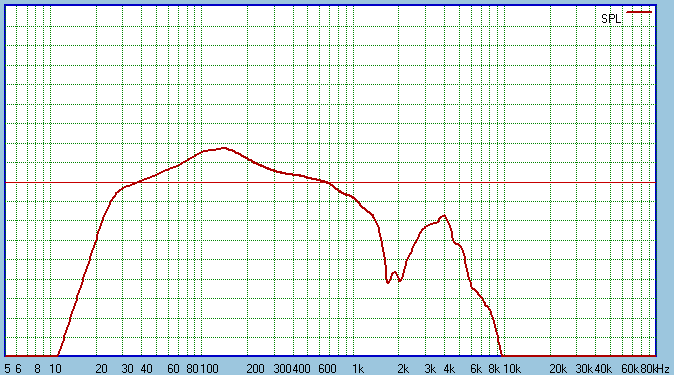
The peak @ 150 Hertz should be ignored somewhat, but
the choke is actually less than first order. No attempt to compensate for
the inductance in the voice coils. The dip at 2KHz is caused by the
difference in distance as shown in the very first diagram in this
chapter. At one metre on axis, the top driver is 1095mm and bottom driver is
1175mm. The difference is 80mm which happens to be half the wavelength at
2KHz, hence the cancellation at that frequency. But do people listen at one
metre? Not really. Look next:

That's better. This is the two metre
measurement and that raises cancellation to almost 4KHz and in most cases it
will be 5KHz or higher. We can now see the shape the choke imparts.
Next the MidBass that is fed by a somewhat more
complex crossover (it is actually not a crossover as it is a contour network
- the ultimate lo-pass function is missing).
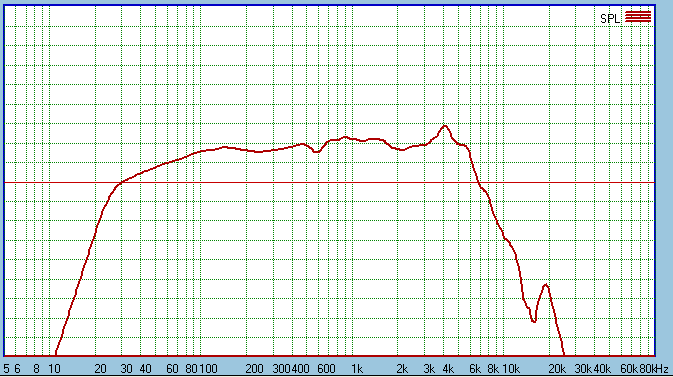
Here are the two raw response before crossover
components applied. We see that there is gradual diffraction loss starting
about 700 Hertz and below, the peak at 150 Hertz tends to hide it, but it is
definitely there.
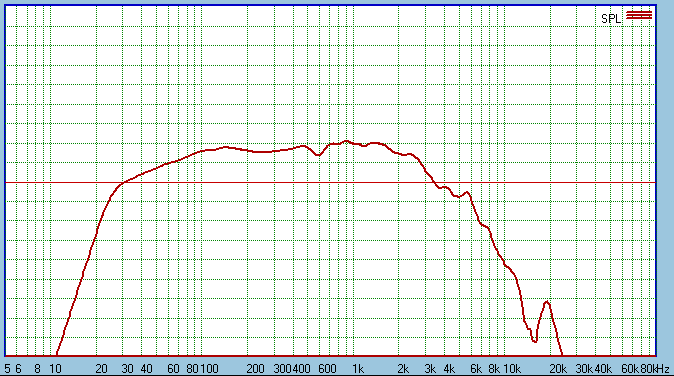
Now we have our crossover (contour network) in place.
We have not compensated for the diffraction loss, look closely and it
will become apparent. The bottom two bass only drivers will easily
compensate for that. This is important as it will help keep the overall
sensitivity (and efficiency) high.
Look at the slope at 10 KHz, it is the same.
The two drivers are rolling off at their natural rate. The parallel choke
and resistor in conjunction with LCR parallel network eliminates the 4KHz
peak. This peak is not a cone resonance (waterfall plots shown
elsewhere proves that) but seems to be a result of the concave dust-cap, a
kind of diffraction effect. The LCR network not only smoothes it out but
also corrects the acoustic phase anomaly caused by the peak. This was a
minor revelation of it own. Almost major, actually.
The combined response:
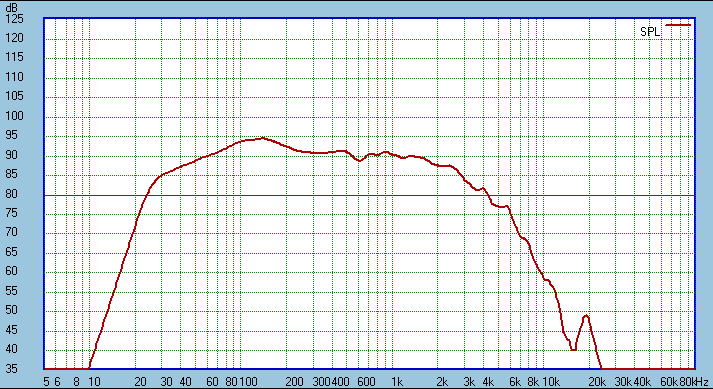
Nice! I could not have hoped for much better than that.
By combining the drivers the diffraction loss has disappeared and leaving
sensitivity up near 90dB while retaining 8 Ohm system impedance. Keep in
mind that the basic single driver is around 88dB before typical 4dB
compensation loss. So we have gained 2dB above that plus the 4dB that
would normally needed to be expended, hence 6dB gain. Yes, other speaker
system do the same but they cheat. They gain is 6dB by paralleling 8
Ohm drivers. That too gets 6dB, but system impedance is now 4 Ohm and the
real gain is only 3dB (the extra 3dBis caused by doubling the current). But
we have gained a genuine 6dB because we have kept system impedance high.
Now it has to be admitted that the last graph was due
to a lot of hard work, but not really all that hard as we could constantly
change and shift values till we got the best results, which we have just
presented on a plate here. Again, this is the power of computer modelling.
Combined Total Response
Let us put it all together, all five drivers:
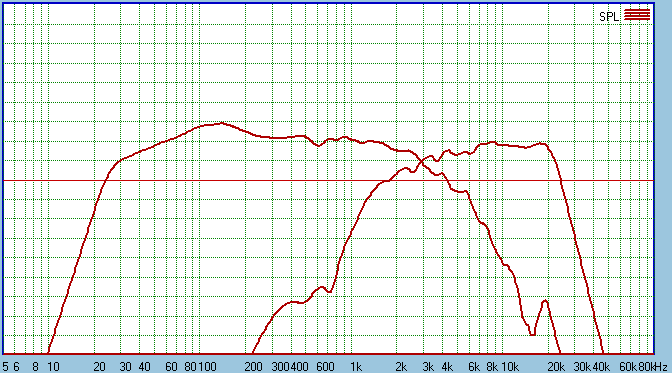
Almost classic first order (almost sub order)
but with interesting features: The Tweeter goes from first order to almost
fifth order at around 1500 Hertz to 500 Hertz. Aside from the 150 Hertz
(please ignore it as a measurement quirk only) the room boost of the 2Pi
response shows that we only need 5dB boundary boost to have flat response
down to 30 Hertz and -3dB near 25 Hertz. We have easily achieved our in-room
target of 25Hz-20Khz frequency response.
Here is our summed response:

We have only covered "Project A" which was On Axis and at
One Metre On Axis. Let me assure you that all other three, B-C-D, check out
OK. Here is Project B - the Off Axis at One Metre:
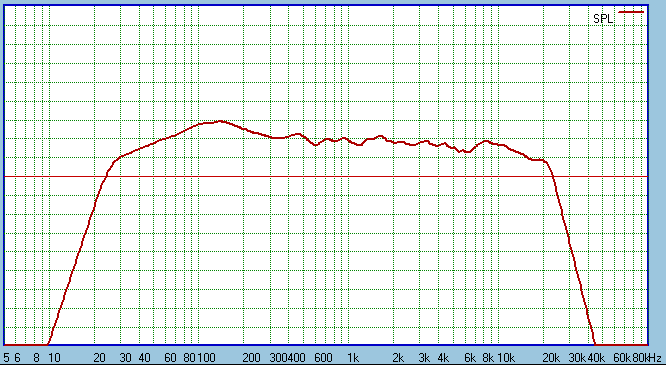
Other than some energy loss at 6-7Khz, the overall
slope is acceptable. Some, like Michael Lenehan, feels that a speaker should
measure this way. Also keep in mind, this is 25° Off Axis, the
preferred listening angle is 10-15°. But this graph shows that we
have a wide and reasonable flat power response into the room.
Let us over-lay the last two graphs:
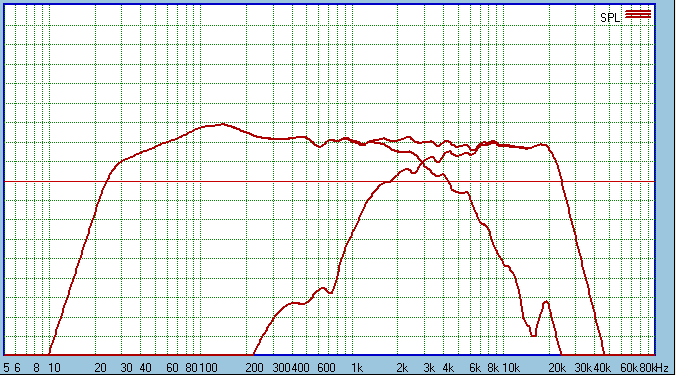
Let us magnify that graph from 5dB/division to
3dB/division:
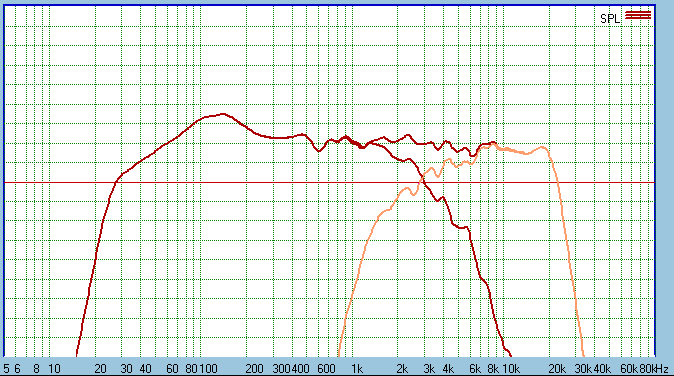
We can see that the summing of the drivers are near
perfect. Drawing the Tweeter's output Orange makes this clearer to see. Look
in the transition between 1200 Hertz and 8KHz - at no point is the any
driver's output subtracted from the other, neither does any single driver
exceed the summed output at any frequency. Small peaks and troughs add up in
the summed response throughout the transition.
This result is what we would want from a Point Source
and we would also expect this to hold up in the Off Axis response:
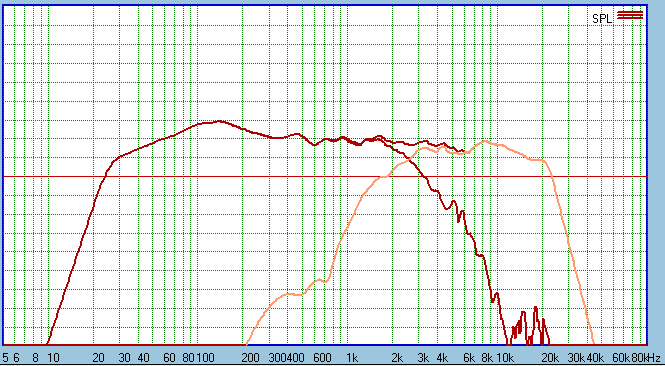
Driver integration, a paramount issue, and what we see
indicates what we and others have heard, it is in the top drawer performance
wise.
Not Yet The Complete Story
We have only really looked at one side of the story.
The other is the electrical domain, by which we mean impedance and phase
angle. As was mentioned in the chapter dealing with speaker design issues,
where we have a frequency where the Z (which is the impedance) and the phase
angle goes significantly negative, this creates additional demands on the
amplifier.
We will plot three-in-one:
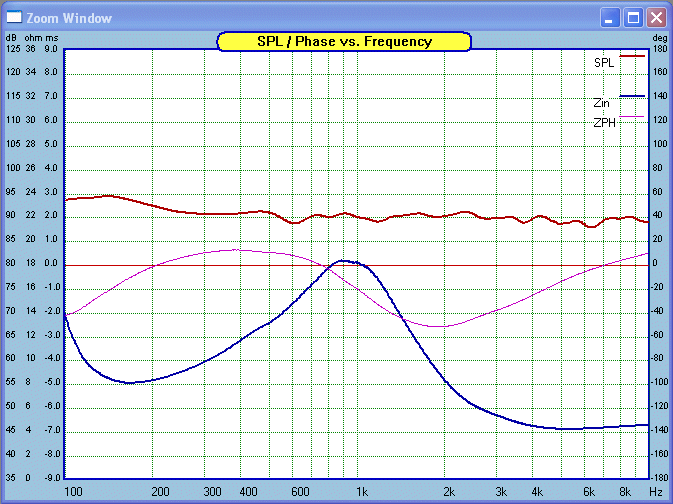
The plot is limited to two decades for clarity. Please
note the numbers in the margins as they will tell you what the graphs are
doing. The Red is the amplitude (frequency) response. The Blue is the Z and
the thin Pink line is the Phase angle.
Clearly the minimum Z is at 5-6KHz and it's 4.3 Ohm.
The minimum Phase angle is at 1900 Hertz and minus 50°. So it is the
latter that is of concern. Yet at that frequency the Z is nearly 9
Ohm. This helps a lot.
But let us not just be satisfied there, we need to
know what is the source of the large negative phase angle at 1900 Hertz. Let
us plot the four larger drivers:
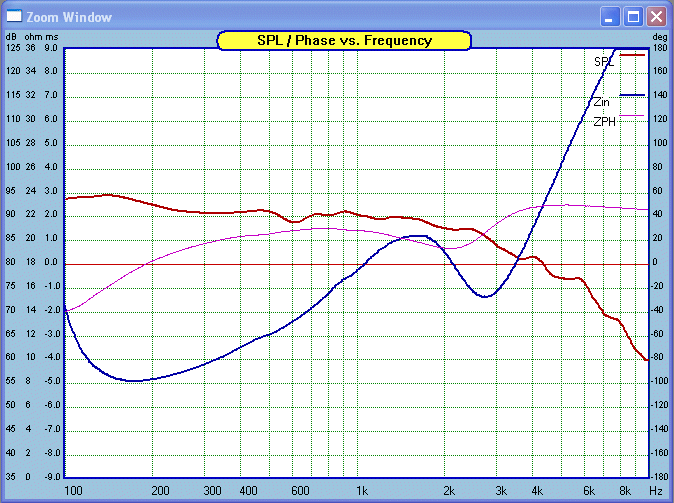
I did plot also beneath 100 Hertz and can tell you
that the second greatest negative phase angle is at 95 Hertz and minus 40°. Yet the Z is a whopping 17 Ohms here. So it is still 1900 Hertz
that we want to know a bit more about. This time we had taken the Tweeter
out and we can see that the Phase angle is positive from 190 Hertz
up. This makes the load inductive rather than capacitive. At 1900 Hertz we
have a Z of 20 Ohm and the Phase is plus 15°.
So it must be the Tweeter, let us take a look:
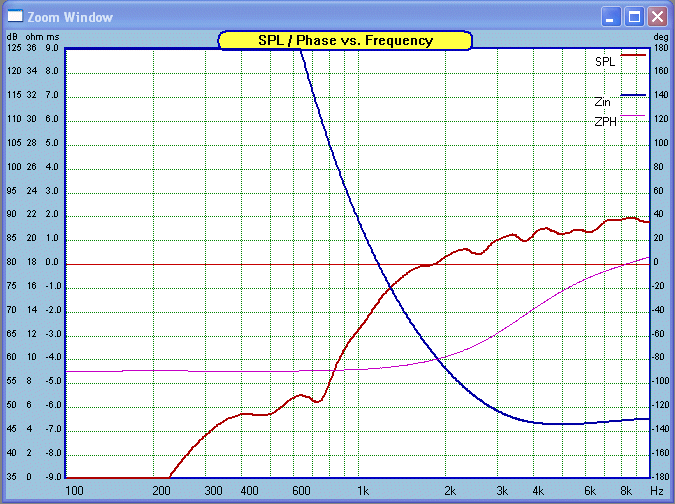
Sure enough, there it is. Since we can largely
discount the Bass and MiBass drivers as having a rather benign load, then we
can examine the Tweeter in isolation. I don't know about you, but I have
looked at a lot of Tweeter voice coils over the years. They are typically
25mm in diameter (one inch types) and not heavy gauge wire as you don't want
a lot of mass. It only takes a few hard watts to damage them. Clearly
Tweeters do not have the ability to get amplifiers into trouble. The
amplifier will win every time!
OK, what does our graph reveal? The large negative
Phase angle is the result of a first order filter with a single large filter
cap. The Notch Filter centred on 500 Hertz is also adding to that, but not
by a huge margin. But at 1900 Hertz the Tweeter's Z is 10 Ohm and at
the same time is 10dB down in the response (relative to 90dB). The Blue line
(Z) is rising steeply at 1900 Hertz as the increasing reactance of the
capacitor is offsetting its increasing capacitive effect.
On a whole I am not unhappy at this when the picture is
seen in its entirety. At 1900 Hertz the primary transducer is the two top
MidBass drivers and they are happily in benign load mode. The Tweeter's
contribution at 1900 Hertz is unlikely to stress the amplifier. It's not a
bad trade-off.
Concluding Remarks
We have covered quite a bit of territory but by any
means have not exhausted this topic. I hope it has given some insight
into the workings of speaker design. The Elsinore Project has been an
ambitious design combining a Line Source in the lower frequencies and then
gradually becoming a Point Source at mid and higher frequencies. It also
incorporates a method where the acoustic impedance of the Tweeter is
enhanced in the crossover region for a smoother and more gradual transition,
more gradual than the usual commercial products so far.
What is important here is that we can model this so
accurately - it is really worth the effort to master the tools that are now
available, and at a reasonable cost. It is how you use these tools
that matter. An apprentice may have the best tools you can buy, but would
you not rather have a master than an apprentice? The tools are
important (try to hammer a nail in without a hammer) but the wielder of the
tool is what matters.
We are very much in favour of this minimal
approach. Once understood it is also the easiest to learn and master. So if
you have the opportunity, go for it!
|