|
Part Seven
[Note: September 2024 - Elsinore Mk6 is current - some things may be
obsolete]
Gathering Acoustic & Z Data
The following page was written
with Mark 1 Elsinores in mind:
Methodology: Treat whole system as a Point
Source, measure and gather data as such. This results in
validated data that can be modelled with greater accuracy. It minimises
potential errors during this phase, and since the electrical data is real
and the acoustic measurements are all amplitude and phase related at a
single point (as represented by the position of the microphone).
As happens with this kind of
project, things start slowly and deliberately, much checking and
double-checking. Gradually it gathers momentum, especially at the point
where the cabinets are made. If you have not covered every base and have in
mind exactly where you are going, then we could face a mini-disaster. At the
end it becomes quite a rush and a mass of activity.

(Old Mk1 Elsinores)
More Photos of
Construction...
Re the whole concept (which
includes a number of sub-sets of concepts), I admit at the outset there were
some nagging concerns. But I went over and over the issues, both in mind and
also using my trusty calculator and using a reliable CAD program and
other suitable tools. You’d be surprised how useful a 2D graphic CAD program
can be in checking angles and measure diagonal lengths that would be a
headache otherwise. You will see an example shortly.
It’s been two years since the
initial sketching and to see things coming together at the end and realise
you did get enough of the details right not to end up with a mess
that simply doesn’t work, and the end result has lived up to expectations,
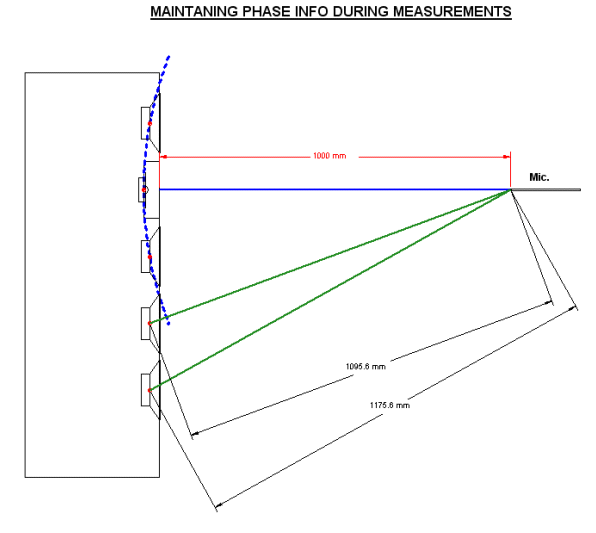
is both a relief and a quiet exhilaration. Here is a diagram generated by my
trusty CAD program. We shall refer to this diagram as the discussion
furthers.
(These were
also checked and modelled at 2 Metre)
Raw Measurements:
OK, where to go from here? I
suppose "Raw Measurements." This is basically the data you need to
accumulate so computer modelling can be a reality. Here the simple rule is
this: They must be accurate and with acoustic measurements, the relative
phase measurements must be maintained.
The above diagram now allows us to
model the whole system as a Point Source. This is
despite the fact that the whole system is not a point source (note the
bottom two drivers), but in the modelling process it assumes that all
drivers are and thus does not change the position of the drivers when
modelling. Amplitude and phase relationships are maintained and the
electrical measurement (impedance and impedance phase) are real
measurements, thus the software can use all three sets of data accurately
when components are inserted between the zero Ohm impedance of the amplifier
(although the affect of changing that can be modelled as well) and the
speakers in situ (the box).
All data must be collected in the
box (electrical) and from the box (acoustic) - a real box.
The Process:
Microphone: Exactly 1 Metre from the
Front Panel proper on Tweeter Axis, see solid Blue Line.
Note that the top three
drivers are equidistant from the Mic. This means that on the Tweeter Axis
the top three drivers approximates a point source. But the bottom
two drivers are different distances, one being 1095mm and the other
1175mm. They will not be point source, but ignore this.
We shall make the following
acoustic measurements:
1. Tweeter:
We shall apply a calibrated pulse method (called MLS) signal to the Tweeter
that equates to 2.83V – the standard equivalent to 1 Watt into 8 Ohm.
2. Top Two
Bass/Mid Drivers: The same measurements but these two drivers
are connected in series and as such provide a 16 Ohm load to the same
2.83V test signal.
3. Bottom Two
Bass/Mid Drivers: Measured exactly in the same way, also series and
2.83V etc.
Even though only taken at 1 Metre,
these are called Farfield measurements.
Now these three
measurements must be taken with the microphone in the same
position.
In this way we are able to capture
the relative phase relationship between all the drivers. This will
ensure that the modelling program will accurately sum the drivers correctly.
It also greatly reduces the complexities when we reach that stage, a classic
KISS situation.
Keep in mind that we
will do two lots of acoustic measurements, one ON axis as
shown in the diagram and the other set of measurements will be OFF
axis. We can then run two parallel modelling programs that give us
simultaneous views of both.
But we shall stay with the ON axis
measurements for simplicity’s sake and later revisit of the OFF axis.
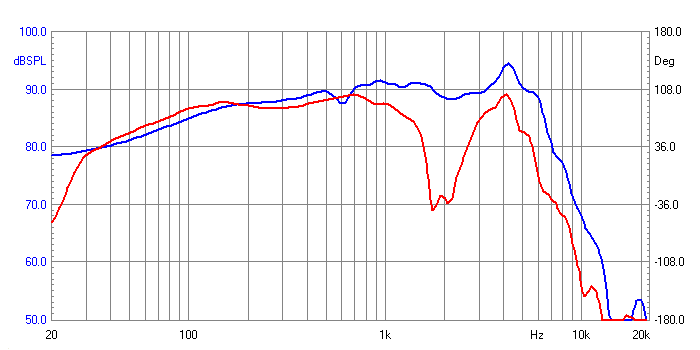
1 Metre ON Axis Farfield Responses -
Blue is Mid-Bass & Red
is Bottom Bass
These drivers sum perfectly as a
single driver at the Mic position. The Red Line represents the bottom two
Bass/Mid drivers. They show a major dip in the response centred on 2KHz.
This is to be expected as the pulses arrive at different times. Look at the
following:
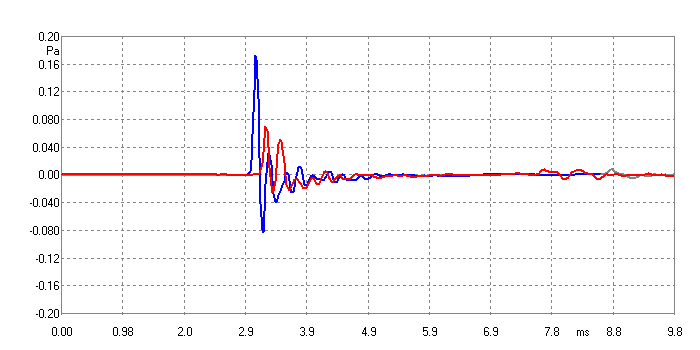
Farfield Impulses (these are ON Axis) -
Blue is Mid-Bass & Red
is Bottom Bass
The Blue Line here represents the
top drivers. Note how they sum into a single and large pulse. The
Red Line
represents the bottom drivers. There are now two smaller pulses arriving at
the Mic at different and later times. They cannot sum up as a larger
single pulse even though they contain the same combined energy even though
the individual pulses are only about half the peak. Our first
diagram allows us to calculate the difference between the delays (actually
the pulse graph does as well by looking at the time difference between the
pulses) and it is 80mm approx.
This 80mm is the same as the
wavelength of 4KHz approx. So the halve-wavelength is 2KHz – and
halve-wavelength equals 180° phase shift and hence large cancellation at
2Khz.
It is not as bad as it looks, not
by a long shot. I don’t know about you, but I don’t listen to speakers at 1
Metre. So going back to my trusty 2D CAD and using the same technique, at a
distance of 2.5M becomes 35mm and the dip up to 5KHz. As we shall be rolling
the bottom drivers off slowly above a few hundred Hertz, this all becomes
inconsequential. Ignore the dip.
The other observation, in the
responses above, ignores the curve below 200 Hertz. They are inaccurate as
we have windowed the pulse. Here is an example:
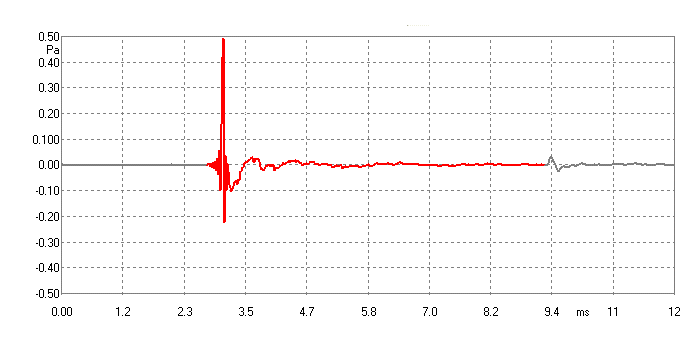
Windowed Pulse
Note it has been cut of before the
‘wriggle’ (that is the reflection caused by the floor between the speaker
and the Mic) and also the delay before the pulse. We can see the window is
about 6 milliseconds, so it is only valid down to 1/0.006 = 166 Hertz.
(Actually we will not window/edit time before the pulse as we need that for
modelling later).
We shall later use Nearfield measurements to fill
in the missing data. But Farfield gives us most of the valid data, including
the critical phase relationships and also the correct SPL data.
Now let us take a look at the Tweeter’s acoustic
response:
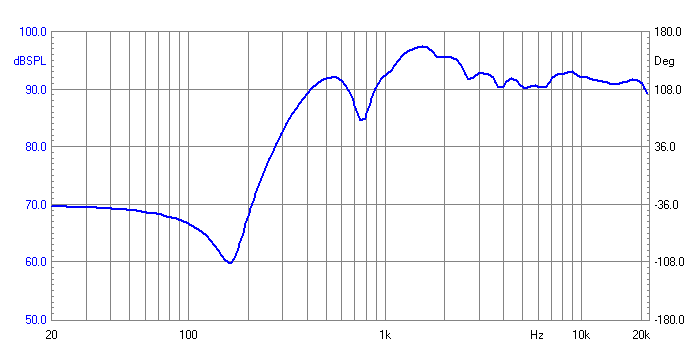
Tweeter ON Axis Response
Again ignore data below 200 Hertz.
This response contains considerable features. But to understand them, please
take a look at what I have called the Diffraction Wedge that surrounds the
Tweeter. This is required as the Tweeter sits fairly deep into a cavity. If
left like that the response would look quite horrible. I may at a later
stage show you what it looked like, but I need to maintain continuity here.
Take a look at the photo:
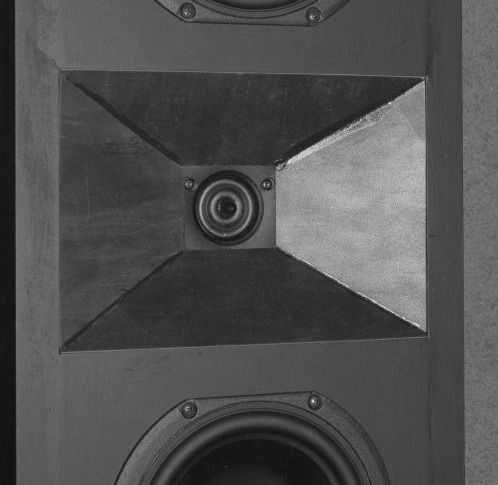
(Obsolete Waveguide - Circular
Waveguise is used today.)
The Wedge is made from thick
heavy-duty vinyl but could also be made from 3mm MDF. This felt is available
from craft stores and elsewhere. There will be
more photos on the website.
Back to our Tweeter response, we can
see the Diffraction Wedge (DW) creates horn loading effect between 1KHz to
3-4KHz. Above that frequency there are no serious problems. The dip is at
750 Hertz is also caused by DW, I could not have asked for a better result
as it is above the 500 Hertz resonance of the Tweeter and well below the
likely crossover point, at least by two octaves. DW is too wide angled to
give a "cup" colouration and the increase in energy indicates the extra air
load aimed for.
Off Axis Response Family:
Here are the same responses as above but at 25° OFF
axis.
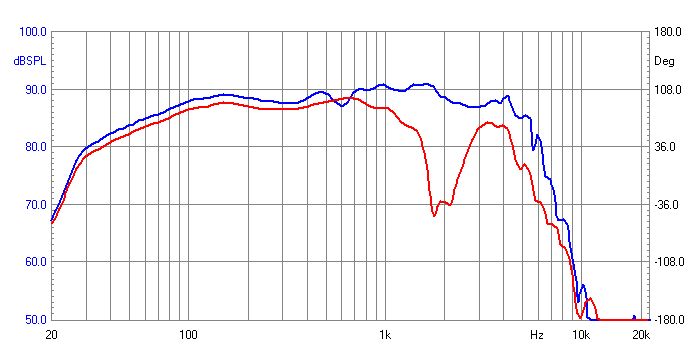
1 Metre OFF Axis Farfield Responses - Blue
is Mid-Bass & Red is Bass
Again Blue Line the upper drivers as a point source
and Red Line are the bottom drivers.
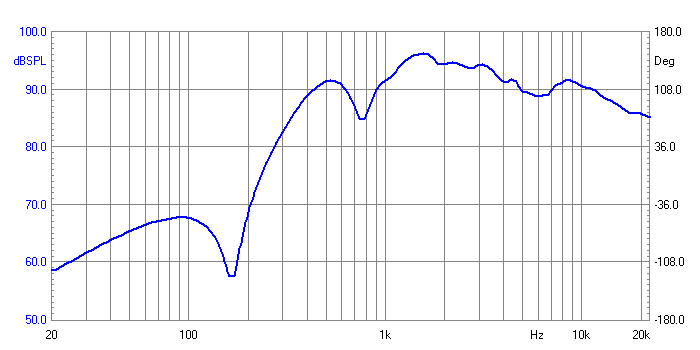
Tweeter OFF Axis Response
The Tweeter rolls of above 10KHz as
is normal and there is a slight loss of energy 6Khz. But much
experimentation with DW made it clear this was the best over-all compromise.
The horn loading is more pronounced to a higher frequency but nothing to
worry about. The 750 Hertz dip is consistent both on and off axis.
Nearfield Measurements:
These will fill in our responses
below a few hundred Hertz. Note that Nearfield measurement will not be
required for the Tweeter. With a little lateral thinking, it can also be
realised that we really only need to measure one of the Mid/Bass
drivers.
When a Nearfield measurement is
made the response is regard as a 2Pi response. As we have discussed earlier,
the Diffraction Loss (DF) will be above a few hundred Hertz, so our Farfield
responses above have already captured the DF and thus the Nearfield comes in
below that point. In fact our first response graph shows the loss is
arrested by 250 Hertz.
Nearfield measurements mean the Mic
is put within 1/11th of the effective diameter of the cone. So it
a cone is 110mm in dimater, then the Mic must be no further away that 10mm.
In most cases I put the Mic about 5-6mm from the cone, or in the case of
drivers 8 inches or large, about 10mm from the cone.
The response graph is then adjusted using this
formula:

The result will be in the minus and
will be in dB, where R is the effective Radius in Metres. Our driver is
133mm so R = 0.0665 – and a calculator will give us –35.6dB. I do reduce the
output to the speakers by minus 10dB (so as to lessen the possible overload
on the Mic) and also since the drivers are in series we also adjust for
+6dB, hence the correction is –31.6dB.
Also the Port needs to be Nearfield
measured as well. Again use the Radius of the Port and do the same
calculation. We get the following Nearfield and Farfield (in this case ON
axis):
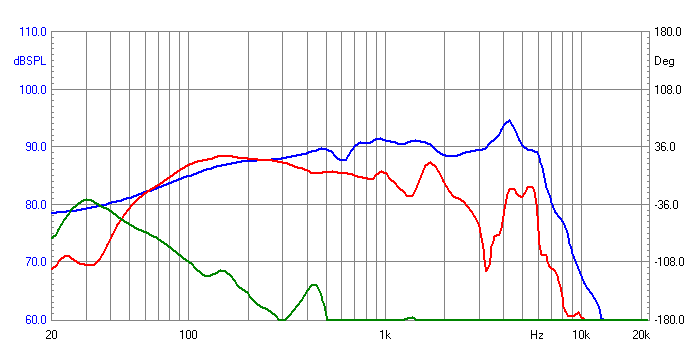
Three Separate Measurements to be
Combined
As a rule I take it as granted that
any data above 500 Hertz are invalid in Nearfield measurements. We can see
that Farfield (Blue) and Nearfield of the driver (Red) converge at a
desirable 250 Hertz, which is where they will be joined. But before
we can do that we have to sum the Port response (Green) with the
Nearfield. The shelving at that point indicates that Diffraction Loss has
levelled out
Cliowin used to capture these measurements allow us
to perform these functions. Here are the final results:
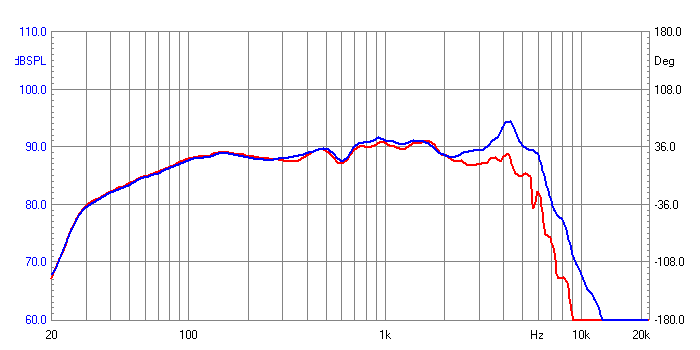
Combined "Top" Responses,
Blue is ON Axis and Red
is OFF Axis.
Here is the same for the bottom drivers:
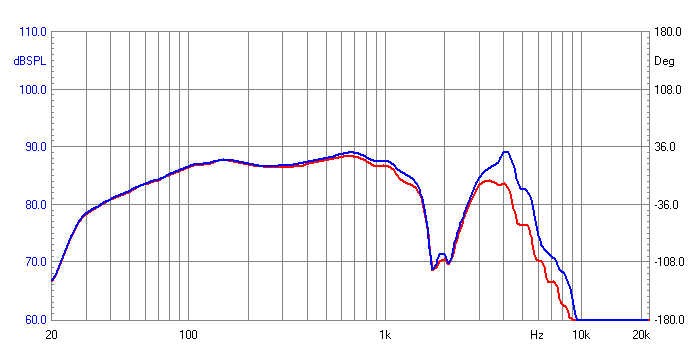
Combined "Bottom" Responses,
Blue is ON Axis and Red
is OFF Axis.
The Blue response is the complete
ON axis and Red is OFF axis. The 2Khz dip moves up to 4-5Khz in actual use
where the response will be about –20dB and hence will have no more than 1dB
affect on the total response. In fact it may be helpful in suppressing the
near 4Khz driver peak.
Electrical Measurements:
These are far simpler. We really only need two as
the pairs of drivers in series are both the same (I checked) and then there
is the Tweeter:
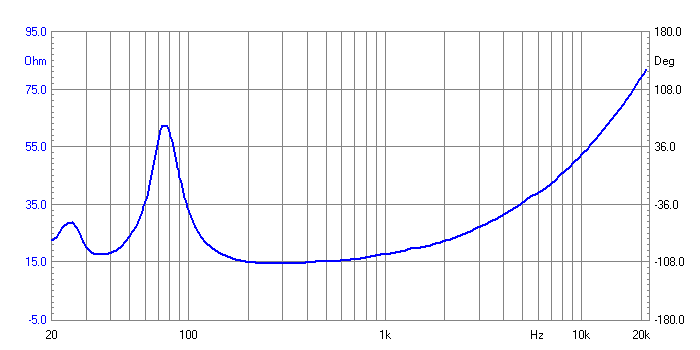
The Bass/Mid drivers measure like a single 16 Ohm
driver and barely drop below 15 Ohm, just as we expected. You can also
clearly see the saddle at 35 Hertz. This is the frequency the box ended up
tuned to. Of course it is easy to change this tuning by varying the length
of our Port. This can be experimented with later.
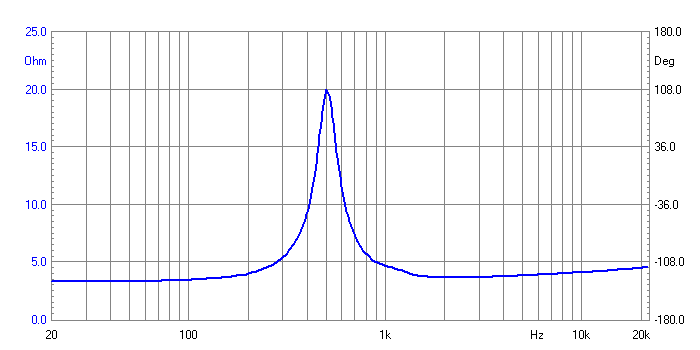
The 500 Hertz resonance is clearly
shown. The Vifa XT25 Tweeter does not use ferrofluid damping and
hence the prominent peak. I believe this to be an advantage, besides it has
been my experience that ferrofluid damping increases the frequency of
resonance (FS) and I prefer not. It also means that you have to deal with
that peak in the electrical domain. It is here we have a neat solution for
the XT25 Tweeter, which will be revealed here (later).
In the above electrical
measurement, the DC resistance of the wiring probes were measured when
shortened and that was subtracted to give above accurate results.
Acoustic Peaks Vs Cone Resonance:
Note the 4Khz peak in the response. At first one
might thing this is some kind of resonance and in a sense it is. But no more
than the box tuning is a resonance and that vented alignment has no less
than three resonant frequencies. We use these to good effect
and thus not all resonant behaviour is destructive. So let us examine this
4KHz peak by using time slicing – or Waterfall plots as it has become
known.
We take the pulse of one of the Mid/Bass (upper)
drivers, ON axis and window it:
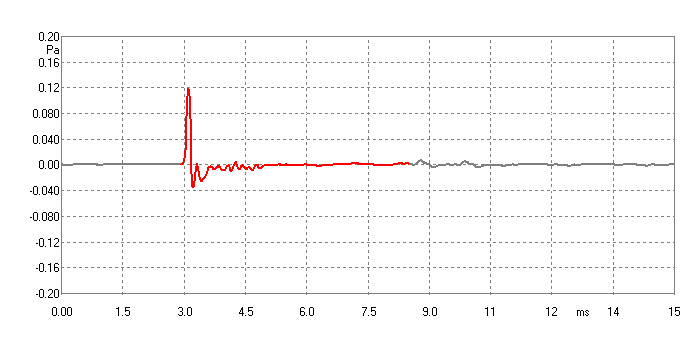
The window edits out the delay
(otherwise the top of the Waterfall plot will be flat) and the main (first)
reflection from the floor. The window is 5.6mS and that means meaningful
data down to 178 Hertz. But we are really interested in what is happening at
4KHz. So we will now covert the pulse to Waterfall:
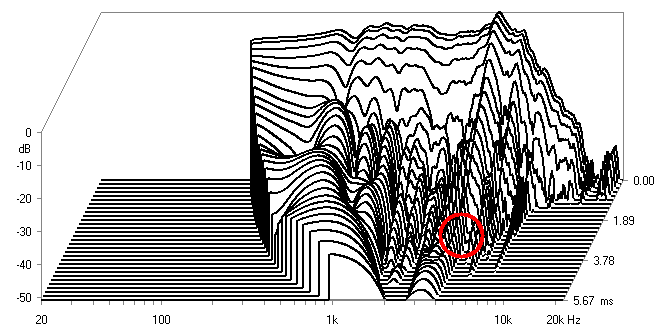
What I see is no severe resonant
behaviour and the Red Circle shows it dying faster than minor irregularities
at 5.3KHz and 7.2Khz. I see this, not as a cone resonance, but as a pressure
point caused in a similar way to diffraction effects that you get when
mounting a driver on a Front Panel, where the flushness and the shape of the
baffle increases pressure at certain frequencies and not others. In my
previous experience, this means we can deal with the peak in the response in
a more benign ways. In the electrical domain we can flatten out the
peak. What is meant by electrical domain? The Crossover.
This will lead into our next
month’s Part Six. But this last plot has also indicated that my plan for the
Crossover is well on track:
I intend to use no
Low Pass Filter on the top Mid/Bass drivers that work as a Point Source with
the Tweeter. I intend to ‘trap’ the 4KHz peak. Adjust for some Diffraction
Loss will mean a parallel resistor with choke. When the choke’s reactance
becomes larger than the DC resistor’s value, this will arrest the Low Pass
function and the Bass/Mids will roll of at their natural rate. No Low Pass
Filter perse’.
So here I will publish the
provisional Crossover with the values shown as the design now stands (they
may be subject to further tweaking).
(OLD OBSOLETE
CROSSOVER BELOW)
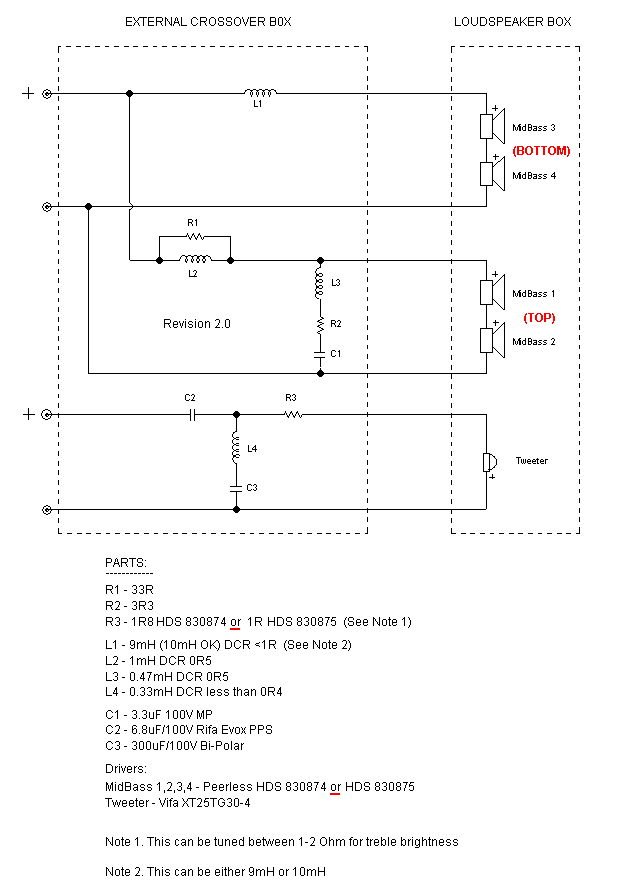
We shall revisit the Crossover in
Part Six. But the combination of L3, R2 & C1 is the
4Khz trap. Also L4 & C3 sucks out the Tweeter’s 500 Hertz
resonance, but also provides a High Order High Pass in the octave above
that, despite the fact it is first order (quite a trick, well worth
revealing in next instalment). These two ‘networks’ are critical to the
performance of the Elsinores.
In the above Schematic, Mid/Bass 1
& 2 are the top two drivers (part of the Point Source). The Mid/Bass 3 & 4
are the bottom drivers. The top drivers are rolled of at their natural rate
near 3-4KHz and the bottom drivers are gradually rolled of from about 200
Hertz at less than first order 6dB/Octave. In fact a first order
filter will be 20dB per decade but in our case it is about 15dB per decade.
The rising inductances of the drivers is not cancelled out by any Zobel
Network as usual. There are reasons for this, but will also be covered in
next instalment.
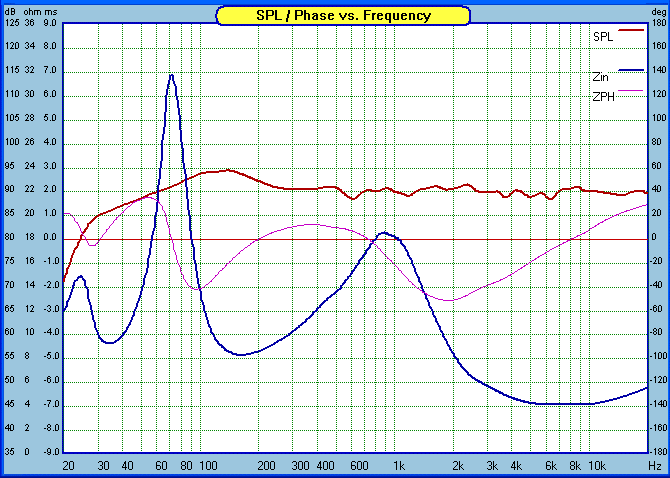
Final Modelled Response
A few people have now heard the
completed (provisional) speakers and the response has been universally good
and only complimentary. This is a big speaker and a sound to match. Clean,
dynamic and sophisticated, low distortion but does not sound sterile.
I am a fan of these HDS drivers as they are inherently musical and
yet have very high definition. They tread a fine line that many others do
not. The Elsinores extract this performance from them to my full
satisfaction.
Also, this speaker is
capable of producing a sense of scale and if you like large orchestral
works, then you will love what they do. They also excel with less complex
structured music. Piano, acoustic guitars etc are reproduced in proper
proportions, no unnatural bloated images. With the right amplifier, they
also have great rhythmic strength (low dynamic compression) and timing is
really good. No sub-woofer is needed unless you want the very bottom half
octave.
More photos of work in progress -
see
Construction Photos
|