|
Part Three
[Note: September 2024 - Elsinore Mk6 is current - some things may be
obsolete]
Box Alignment - A Discussion
In Part Two we covered a
lot of territory, this instalment will be a bit more brief and we will
discuss the box alignment. First we will measure the electrical
characteristics of the drivers. Of course, the Bass-Mid driver is the one we
are primarily concerned with when considering box alignment, but it was easy
to measure both at the same time, so here they are.
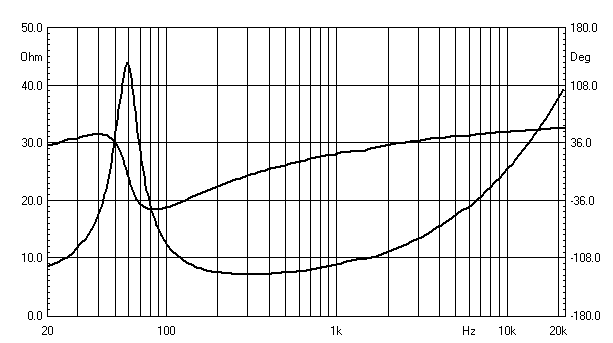
Bass-Mid:

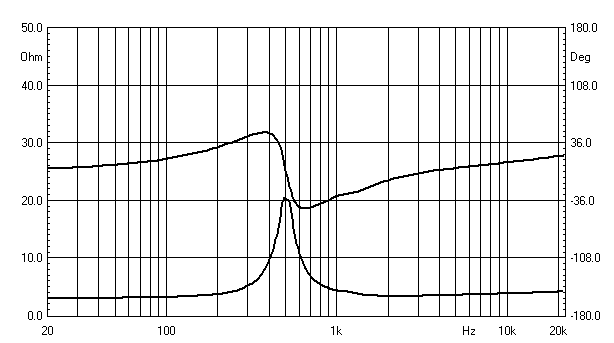
Tweeter:

These measurements were made using Clio Version 7.0
acquired through Pat O’Brien of WAR Audio. A few comments
on the above graphs; the impedance shows that the Bass-Mid is 8 Ohm approx
and the Tweeter is 4 Ohm. You can tell these by the fact they show a
pronounced peak, which corresponds to their “Free Air” resonance, also known
as their “Fs”. The other curve is the electrical phase and the scale on the
right side shows they are -/+ 48° approx for both drivers. Note that
at the Fs the phase is zero degrees? That is no coincidence. In both cases
the phase goes positive below the Fs and negative above the Fs. Eventually
the phase goes positive about two octaves above Fs, this is a natural
consequence of the inductance in the voice coils. When the phase is positive
it is said to be ‘inductive’ and fairly benign. But when phase is negative
it is said to be ‘capacitive’ and if excessive can become a severe load,
especially only the amplifier.
The Tweeter’s negative
phase will mainly be below the crossover frequency and such will not become a
problem. But Bass-Mid’s negative phase of –40° at 80 Hertz approx
would need more careful attention, but this will be modified by the box
alignment and less likely to be an issue. Because we will use lossy
crossover, otherwise known as Transient Perfect, I hope to have the overall
phase response positive from 300 Hertz and up. Even if it should go
negative, then it should do so moderately.
The key to
provide an easy load is to avoid combining negative phase and
low impedance at the same frequency. If we can keep the impedance higher
than six ohm, even –40° at one frequency should not present a
problem.
Since the impedance graph
shows a minimum around 7 Ohm at 200 Hertz and –18° at that point, it
will be logical that this will not be a speaker that creates any problem for
any amplifier load wise.
We shall be able to
maintain minimum impedance at 7 Ohm up to and near where we cross over to
the Tweeter. But I suspect there will be some padding down (designer speak
for reducing the output) of the Tweeter and this will be accomplished by
adding some series resistance, which will likely up it to near 6 Ohm. If we
can keep the system impedance above 6 Ohm, then this will qualify as a
genuine 8 Ohm design and this will be our target. Even if we fall short in
the top octave it should be positive phase above 10KHz. Needless to say, all
this will need to be played out, but it all augurs well.
Thiele-Small
Parameters
Now let us examine the
electrical driver characteristics of the Bass-Mid. From these we can extract
the Thiele-Small (also known as T-S) parameters. It is not generally
understood that T-S measurements are electro-mechanical as opposed to
acoustic. This separation of electrical and acoustic needs to be
appreciated. Strange as it may seem, it is the electrical parameters that
allows us to model the box alignment and the acoustic measurements comes
later after the box has been constructed. Don’t worry if this
confuses you now, but we will revisit this and will become clearer why.
The example below is the
Peerless HDS driver used in Mk1 to Mk3.
The published T-S
parameters are:
Fs
47.3 Hz
Qms
2.73
Qes
0.47
Qts
0.4
Sd
139 cm2
Vas
16.7 Litres
Sensitivity 87.8 dB
Next by adding a known amount of mass, such as Blue-Tack, to the cone, as
well as supplying Sd (the effective cone area) Clio can now fill in the
remaining parameters:
Fs
54.4 Hz
Qms
2.666
Qes
0.5012
Qts
0.4219
Next by adding a known
amount of mass to the cone as well as supplying Sd (the effective cone area)
Clio can now fill in the remaining parameters:
Vas
14.1 Litres
Sensitivity 88.5 dB
Now you can tell that
they are not the same, so what gives? Don’t worry this is not entirely
unusual. Note that Fs has increased by 15% and Vas has decreased by
18%. This indicates that the suspension is still stiff and as the driver
gets used the Fs will lower and Vas increase as the suspension becomes more
compliant. Also the internal test method of Clio is very low power and the
same test using increased signal level will also show lower Fs and higher
Vas. Other parameters are within 5% but will also change slightly, so the
published specs correlative reasonably well, just give it time. The
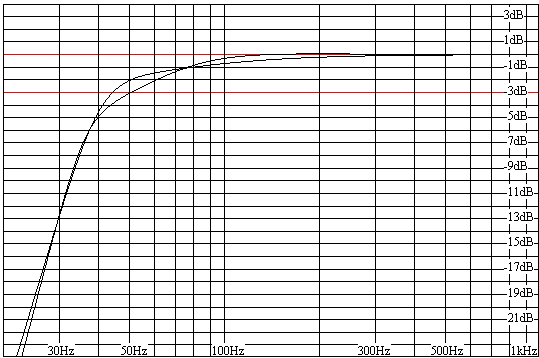
interesting thing is that in the same box, the alignment does not change as
much as you would think. See below:

Chances are the end
results will lay between those two curves. But we do have a mechanism that
will help us in the end. The above alignment is based on four drivers in
series parallel and the box volume of 75 Litres and vent tuned to 40 Hertz.
In a
sealed box the resonant tuned frequency Fc is determined by a combination of
both driver parameters and the box volume. In a vented box the tuned
frequency Fb is dependant on the box only.
This means that in the
end when the box has been made we can tune the box frequency by varying the
depth of the vent. Hence if we feel the box sounds a little too dry, we can
shorten the vent and tune to a higher Fb and vice versa. Previous experience
with the predecessor of this driver indicates that the above alignment
should work nicely, but the individual user has the option to tweak Fb to
suit them. Not an option available with sealed alignments.
The Colloms Curve & Average Room
Remember our earlier
discussion re Diffraction Loss. Recall that this creates a step in the
response because sound wraps around the front baffle below a certain
frequency causing a theoretical loss of 6dB? What happens to that sound
below this step? It is of course still in the room and is constrained by the
room boundaries. When the wrap-around-energy meets the rear wall, ceiling,
side walls and floor, something remarkable happens. Take a close look at the
following graph, courtesy of Martin Colloms and his book High Performance
Loudspeakers:

This graph is only a
guide. But it indicates a rising response at low frequencies. As speakers
descend in frequency they become increasingly omni-directional. This means
they become, gradually, a spherical radiator. The increased energy then gets
bounces back into the room. The above shows the average room
corrected response. This now needs to be superimposed on a standard 2Pi
response, and we get the following results.

Our in room target will
be –6dB at 30 Hertz as represented by the cross-hairs. There are two
alignments shown:
1. Vb-1.
This is a computer generated optimally flat 2Pi response. It is clear that
if average room correction was applied, there would be a significant peak
around 50-60 Hertz. This 4th Order Butterworth design has pour
transient response relative to Bessel Alignment. Our driver is not suitable
for Bessel, but a similar amplitude response can be chosen that is similar
and that will have improved transient response.
2. Vb-2.
This is our chosen alignment. Note that the initial roll-off is more like
that of a sealed box. It has much better transient performance.
3. Vb-2
(Colloms Adjusted). This is the average room response. Note that we
are only –1dB at 40 Hertz relative to the zero line. Our in room response
target of better than –6dB at 30 Hertz is also met. The 24dB/Octave Line
shows that the ports maintain output down to about 27 Hertz before reaching
maximum slope.
We have chosen an
alignment, Vb-2,
that can be classed as veering towards the dynamic, whereas
as Vb-1 is a static type alignment. The dynamic type alignment better
integrates with the room. Nearly all speakers have an in room elevation
between 60-80 Hertz. Even though we have chosen a dynamic alignment, this
elevation is kept under 2dB. The static alignment would have an even larger
and potential a peak in the response, at least ours is reduced and flat.
For those with a different taste, we can tune the box to a higher Fb and go
for a static alignment (not recommended) or a compromise between the
two. This nicely introduces the next appropriate subject:
Another Golden Ratio?
Let me introduce you to a
concept that is rarely mentioned or understood. In the end we use this to
fine tune the box, and as this is DIY, even for our own room and taste.
I refer to the ratio
between the Fb and F3 in vented boxes. Here Fb represents the frequency the
box is tuned at via the use of a vent (remember this is independent of the
driver) and F3 represents the frequency where the response is 3dB down. Look
at the Vb-2 curve, note that it is tuned at 40 Hertz, so where is the F3?
About 53 Hertz. Now divide F3 by 40 equals 1.325 and thus:
F3/Fb = 1.325 (53/40 = 1.325)
In a 4th Order
Butterworth as shown in Vb-1, the F3/Fb = 1,
yes one and then we have a static alignment. When F3 and Fb are the
same the transient response is not optimum (and neither is frequency
response, as we shall see later. If we increase the
F3/Fb ratio to 1.2 things improve significantly and about 1.3, a more
dynamic type alignment, which is what our target will be initially.
Going too much above 1.3 and we start to over damp and the bass will start
to become too dry and the roll-off is too great for bass extension.
When the speaker is
listened to, we can revisit the box tuning. By increasing Fb up to 42-44
Hertz (just shorten the vent) we can try F3/Fb
= 1.2 and see if we like that as a compromise. Maybe in larger rooms the
latter may work better whereas in most rooms 1.3 will be about right. The
beauty is, should you choose to take up the challenge and build this speaker
system, don’t permanently fix the port (vent), but try shortening it
gradually while listening and fine-tune it to your requirements. You could
never do this with a sealed box alignment as only with vented alignments the
box tuning is independent of the driver. The ratio
F3/Fb is a
great tool for the DIY buffs, even if it is a bit useless for a manufacturer
who has to settle for a fixed point.
What Next?
The box drawings have
been complete for a while. Bernard Chambers (the sponsor who has paid for
the drivers) has just picked up the drawings and it is hoped over the next
month or so they will be built. We can then mount the drivers in the box and
start the next phase.
Earlier I said we must
start with the electrical characteristics and how they help us to extract
the Thiele-Small Parameters, which in turn allows us to design the box
alignment. Then the drawings are prepared and the boxes built. Once the
drivers are mounted we can get onto the interesting acoustic
measurement. Combined with Thiele-Small Parameters we can use the collective
data and computer model the crossover.
These acoustic
measurements must be done in situ. It is not possible to measure the
drivers’ response unless they are in the exact location that they are used
in. Only electrical measurements can be performed outside the box.
But now we are also faced
with something else, the box will now also modify those parameters.
It is important then to distinguish between raw date and in box
data. When doing computer modelling, we use the raw data for driver
parameters, but impedance and acoustic measurements we use in box data.
Next:
Construction Drawings and Notes
|